SMALL
Why do I hold $XRP? This video should make it clear. 😤🌍🔀🌐
☞ 나는 XRP가 이 패턴을 만드는 것을 여러 번 보았기 때문에 다음에 무엇이 올지 정확히 알고 있습니다. 현재 XRP 차트는 2017년 2~3월과 동일한 위치입니다. @IooP_rM311_7211 포물선 인입.
| NotFinancialAdvice.Crypto@NFAdotcrypto · Oct 1 Why do I hold $XRP? This video should make it clear. 😤🌍🔀🌐 https://twitter.com/i/status/1575880960041943040 $XRP를 보유하고 있는 이유는 무엇입니까? 이 비디오는 그것을 분명히 해야 합니다. 😤🌍🔀🌐 https://twitter.com/i/status/1575880960041943040 |

| DAVEED 🌔🏝@LunarBeaches · Sep 29 I’ve seen XRP make this pattern so many times that I know exactly what comes next. 나는 XRP가 이 패턴을 만드는 것을 여러 번 보았기 때문에 다음에 무엇이 올지 정확히 알고 있습니다. |
 |
 |
| (X)=chi (R)esurrected(P)=rho@Cryptobilbuwoo0 · Sep 30 #xrp #Ripple @IooP_rM311_7211 Parabolic incoming. 🗝🎄🔆 #xrp #리플 @IooP_rM311_7211 포물선 인입. 🗝🎄🔆 |
 |
 |
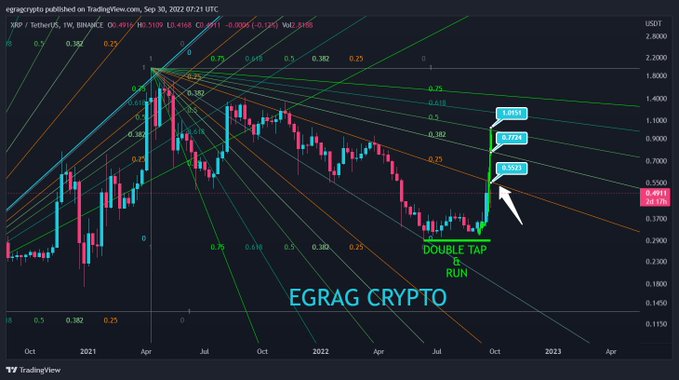
| #XRP #Ripple #xrpthestandard #xrpgold The same location as in Feb-Mar 2017. 1. DXY 2. BTC.D & ATL.D 3. Total & Total2 & ETHUSD 4. XRPUSD & XRPBTC XRPUSD: Fibonacci Ratio & Trendline, Support line(green) & Double bottom Target: 1.618 & Cup & Handle pattern(26~27$) 🗝️🎄🌞 #XRP #리플 #xrpthestandard #xrpgold 2017년 2~3월과 동일한 위치입니다. 1. DXY 2. BTC.D & ATL.D 3. Total & Total2 & ETHUSD 4. XRPUSD 및 XRPBTC XRPUSD: 피보나치 비율 및 추세선, 지지선(녹색) & 이중바닥 대상: 1.618 & 컵&핸들 패턴(26~27$) 🗝️🎄🌞 |


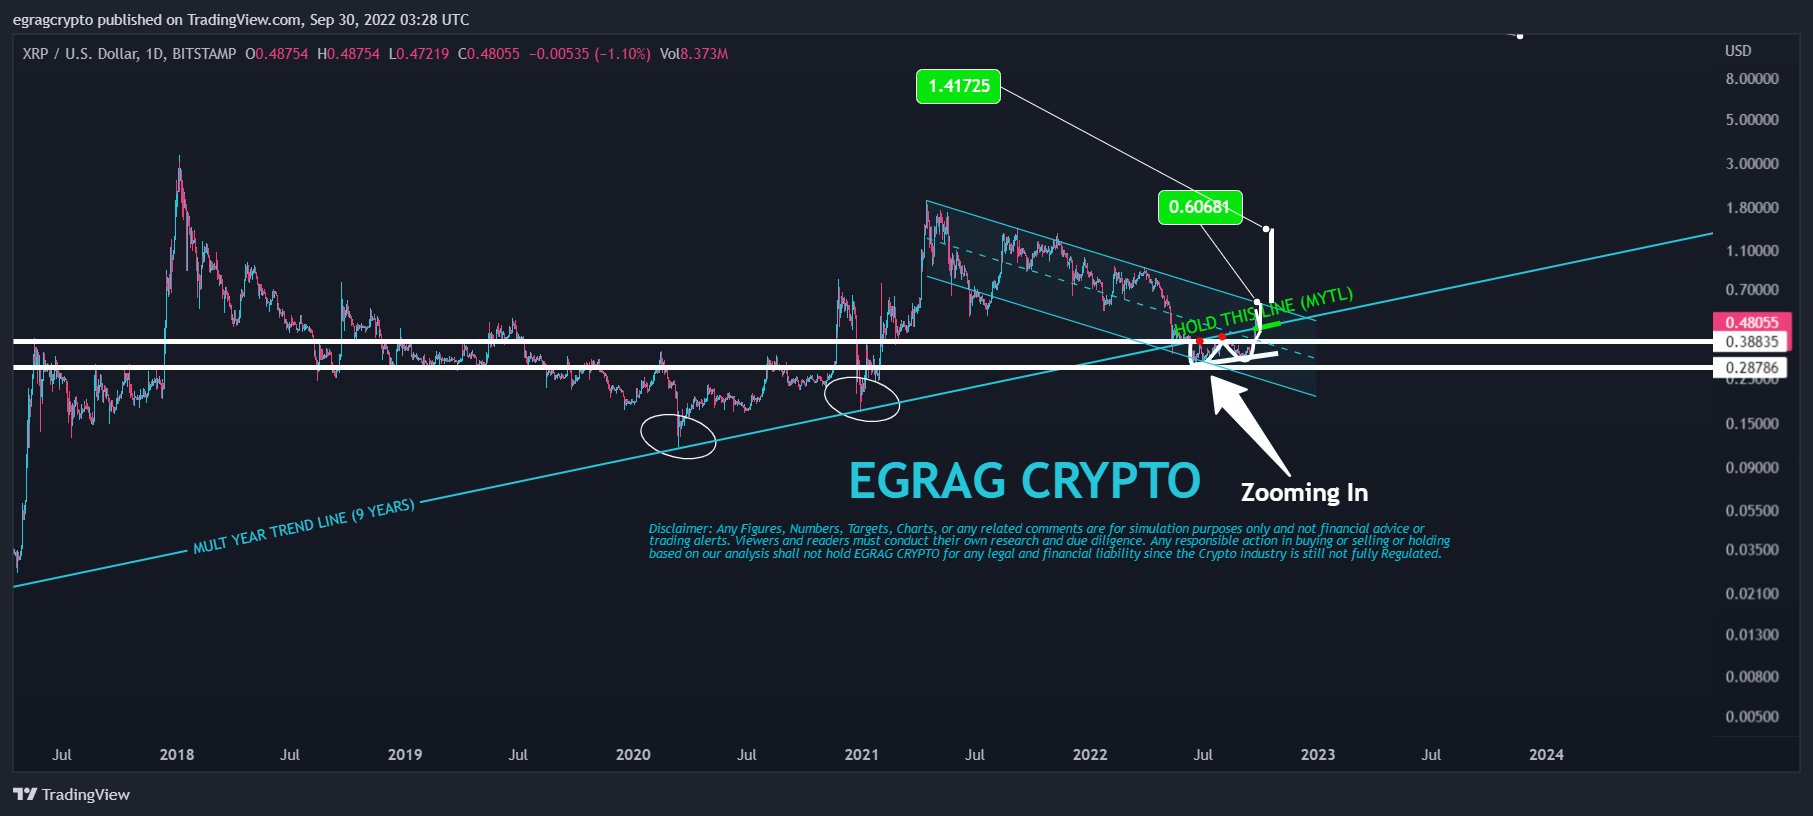
| EGRAG CRYPTO@egragcrypto · Sept 30 #XRP UPDATE: #XRP broke out on 4 H, it might come for a retest which should hold. This MOVE is one of the most critical moves for #XRP since closing above 0.59c - 0.60c means we r above the descending channel. This is Super Super #Bullish #XRP 업데이트: #XRP는 4 H에 발생했으며 유지해야 하는 재테스트를 위해 올 수 있습니다. 이 MOVE는 #XRP에서 가장 중요한 움직임 중 하나입니다. 0.59c - 0.60c 위에서 닫는 것은 내림차순 채널 위에 있다는 의미입니다. 슈퍼슈퍼 #불리쉬 입니다. |

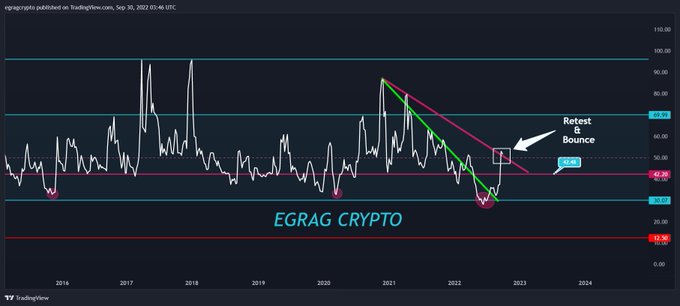
| #XRP Weekly RSI: Check the Green Line how it broke out & did a retest of the Trend line & Boom. What is expected that the Pinkish line to hold the retest so we can confirm the bounce is coming. #XRP 주간 RSI: Green Line이 어떻게 발생했는지 확인하고 Trend line & Boom을 다시 테스트하십시오. 핑크빛이 도는 라인이 예상되는 재테스트를 통해 확인해볼 수 있는 바운스가 오고 있습니다. |
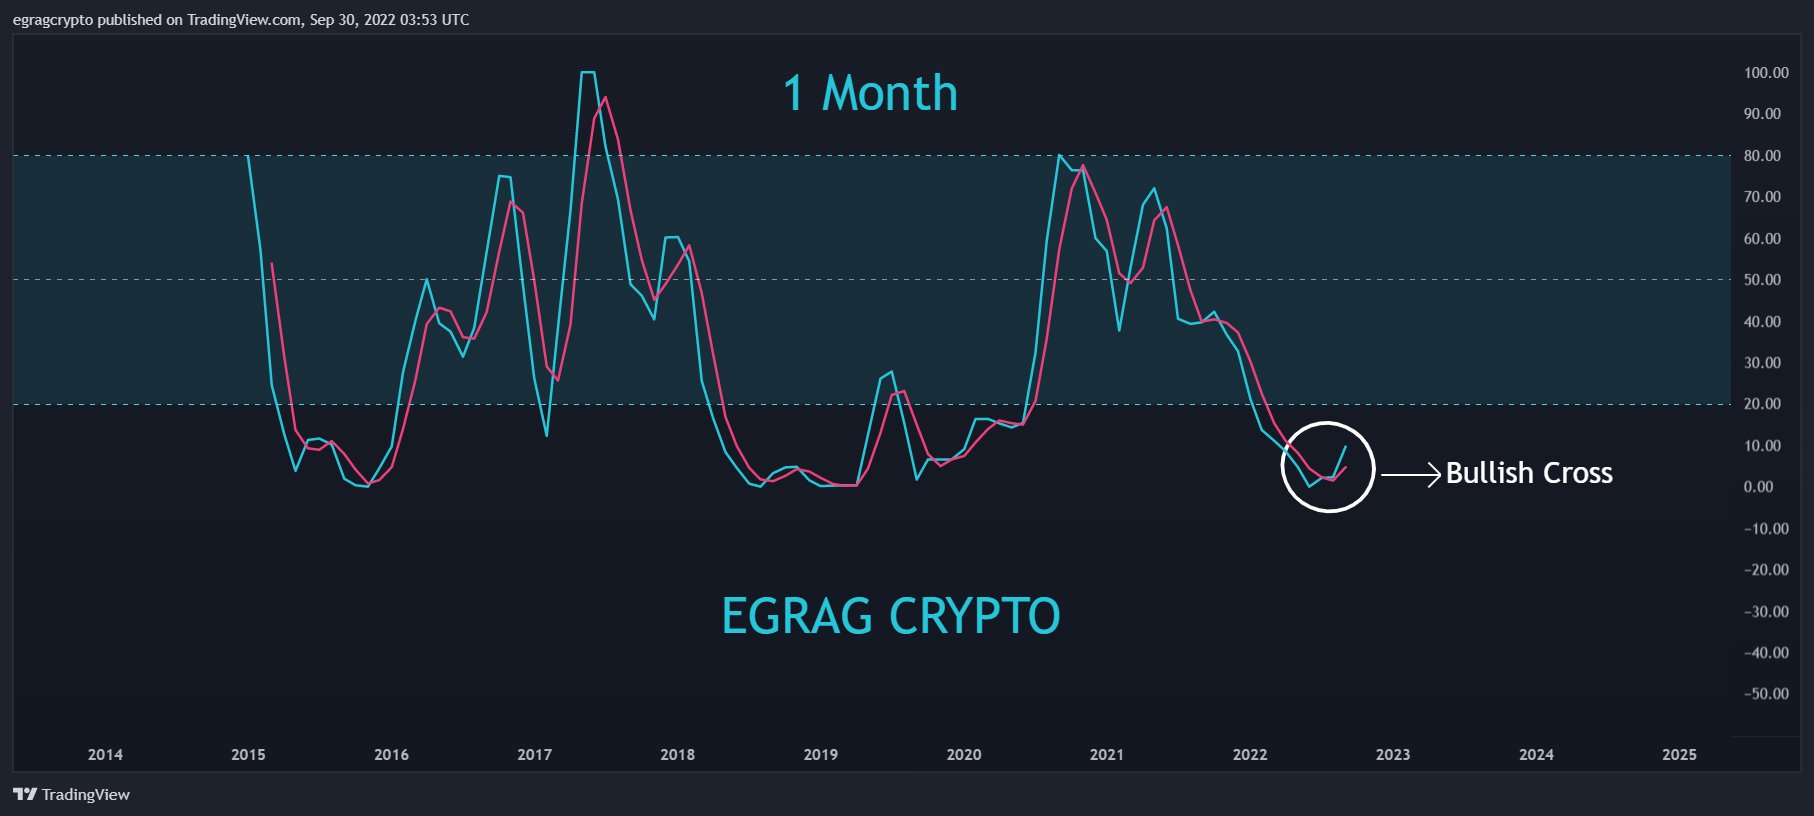
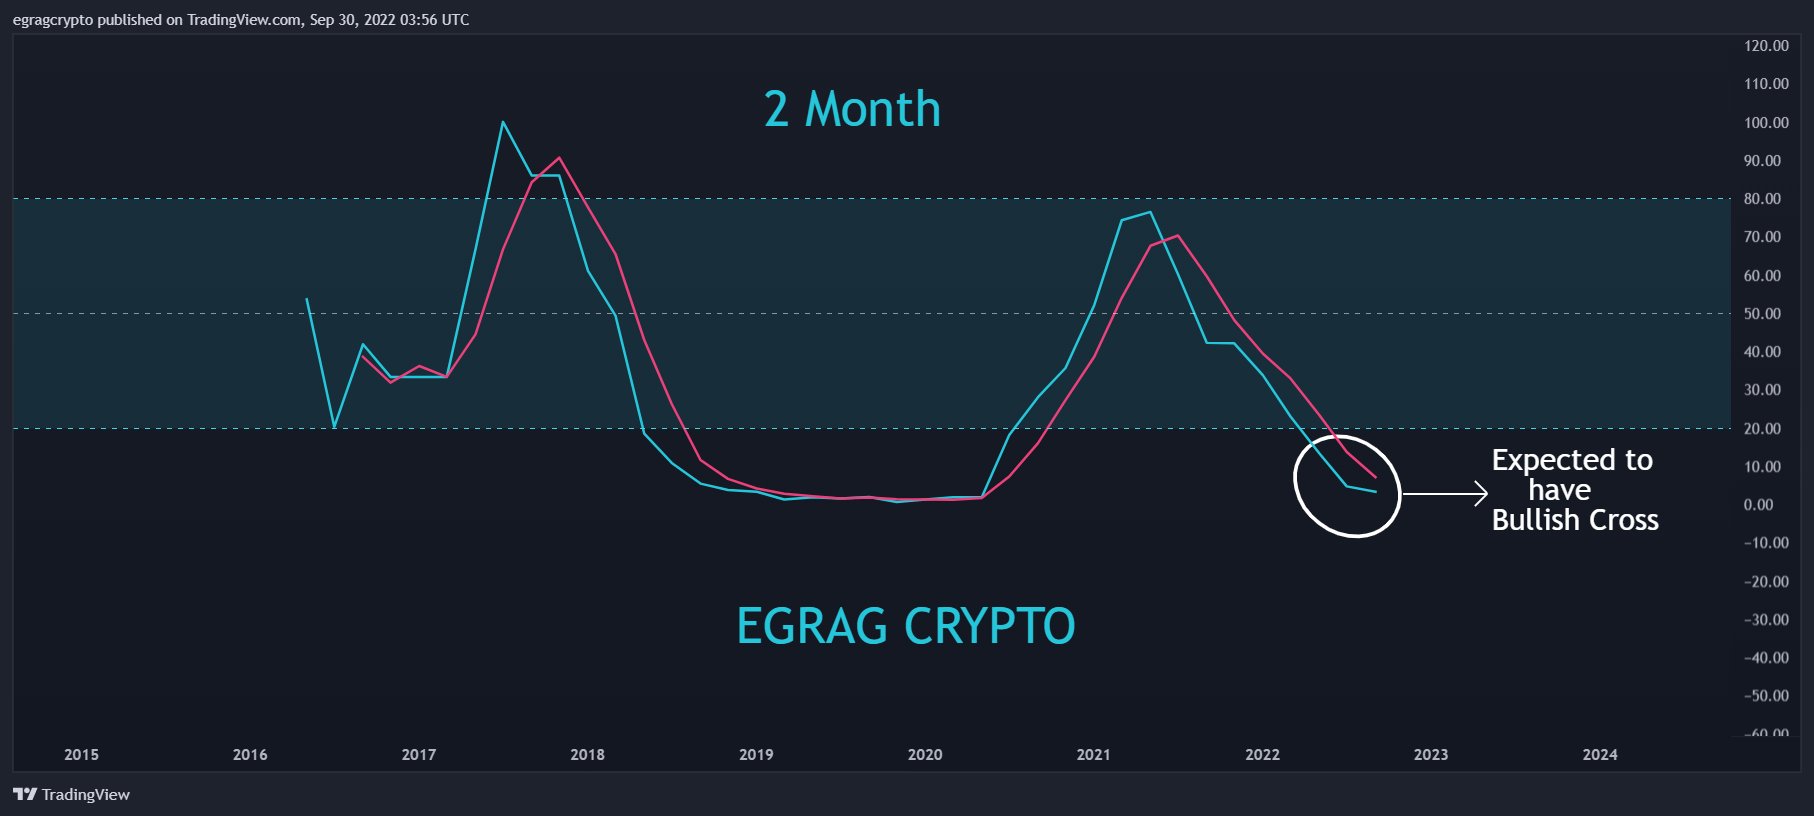
| #XRP S-RSI ( 1 Month & 2 Months): When in Doubt Zoom Out, it will make you feel relieved & provide you a holistic strategic approach. The below Charts : S-RSI ( 1M & 2M). #XRP S-RSI(1개월 및 2개월): 의심스러운 축소 상태에 있을 때 안도감을 느끼게 하고 전체적인 전략적 접근 방식을 제공합니다. 아래 차트: S-RSI ( 1M & 2M). |
| #XRP Bollinger Bands (BB) & Descending Channel (DC): The mid of BB (T1, 0.51C) is acting as resistant but flipping it into support is super #Bullish. T2 (Target 2) is the upper-mid level of BB & it will be above the DC. Hitting T2 (0.70C) is essential to Hit T3(0.90c) #XRP 볼린저 밴드(BB) 및 내림차순 채널(DC): BB의 중간(T1, 0.51C)이 저항으로 작용하고 있지만 지지선으로 전환하는 것은 매우 #강세입니다. T2(Target 2)는 BB의 중상위 수준이며 DC 위에 있습니다. T2(0.70C)를 치는 것은 T3(0.90c)를 맞추는 데 필수적입니다. |
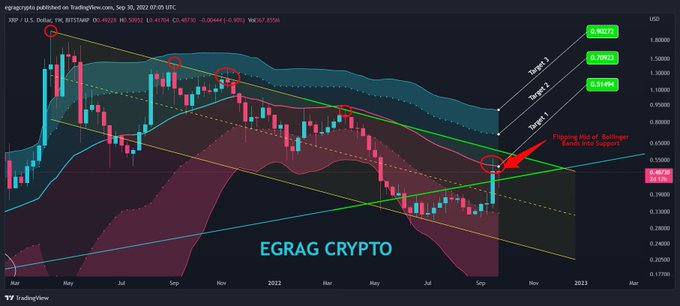
| Upon hitting T2 & retesting neck of the DC with huge bounce, then the doors of Valhalla r opened wide for potential 5 impulsive waves. Some will keep on doubting it until they see it. The below chart is a Confluences Chart. T2를 치고 DC의 목을 거대한 바운스로 다시 테스트하면 Valhalla r의 문이 잠재적인 5개의 충격파에 대해 활짝 열립니다. 어떤 사람들은 그것을 볼 때까지 계속 의심할 것입니다. 아래 차트는 Confluences 차트입니다. |
LIST
'엑스알피 이야기' 카테고리의 다른 글
| XRP 가격이 두 자릿수로 상승하면 구매자가 이 수준을 방어할 수 있습니까? (0) | 2022.10.01 |
|---|---|
| 가격이 12% 급등하면서 6억 6,300만 XRP가 대량 덩어리로 연결됨, 나는 $XRP가 지금 미쳐가기를 원합니다. 🚀 (0) | 2022.10.01 |
| XRP 월간 마감: XRP가 850% 움직일 수 있나요!!! (0) | 2022.10.01 |
| XRP 지갑, 투자자 관심 증가에 따라 400만 돌파 (0) | 2022.10.01 |
| Poly Network, XRP 원장을 통합하여 크로스체인 결제 촉진 (2) | 2022.10.01 |